Oversold RSI with Tight Stop-Loss Strategy (by Coinrule)KRAKEN:LINKUSD
This is one of the best strategies that can be used to get familiar with technical indicators and start to include them in your rules on Coinrule .
ENTRY
1. This trading system uses the RSI (Relative Strength Index) to anticipate good points to enter positions. RSI is a technical indicator frequently used in trading. It works by measuring the speed and change of price movements to determine whether a coin is oversold (indicating a good entry point) or overbought (indicating a point of exit/entry for a short position). The RSI oscillates between 0 and 100 and is traditionally considered overbought when over 70 and oversold when below 30.
2. To pick the right moment to buy, the strategy enters a trade when the RSI falls below 30 indicating the coin is oversold and primed for a trend reversal.
EXIT
The strategy then exits the position when the price appreciates 7% from the point of entry. The position also maintains a tight stop-loss and closes the position if the price depreciates 1% from the entry price. The idea behind this is to cut your losing trades fast and let your winners ride.
The best time frame for this strategy based on our back testing data is the daily. Shorter time frames can also work well on certain coins, however in our experience, the daily works best. Feel free to experiment with this script and test it on a variety of your coins! With our back testing data a trading fee of 0.1% is taken into account. The fee is aligned to the base fee applied on Binance, which is the largest cryptocurrency exchange by volume. In the example shown, this strategy made a handsome net profit of 52.6% on Chainlink with 66.67% of trades being profitable.
You can execute this strategy on your favorite exchanges with Coinrule .
Pesquisar nos scripts por "stop loss"

isamuch - 2MA Cross and Stop Lossสัญญาณซื้อ/ขาย : มาจาก Moving Average สองเส้นตัดกัน
Stop Loss : มาจากราคาต่ำสุด/สูงสุดของช่วงระหว่าง Moving Average สองเส้นตัดกันก่อนหน้ากับ Moving Average ตัดกันปัจจุบัน

Parabolic SAR Strategy With take profit and stop lossDo not make it too difficult!
This is my first strategy! I took the Parabolic SAR Strategy and added Stop Loss and Take profit, and I can see some fantastic results in 2h-3h-4h on some of the Crypto coins.
This is for training only, and I do not recommend using it as part of a trading bot, however, I do myself.

MultiPrice AlertThis is an alert script using Pinescript version 4. This enables one to set 5 alerts (1 StopLoss, 4 Targets), on 3 different symbols, at using a single alert in the UI.
Every visible line will only appear on the symbols that are selected. After setting targets when making an alert, select this indicator as a condition. Change the name to whatever you want, usually the names of the set of tickers.
The Alert message is dyanmic showing which Symbol with each type of alert, at whatever price.
Ability to disable the targets + symbols.
Alerts work by Stop Loss crossing under price and Targets Cross Over. Enabling the "Short" Targets reverses this.
The line that is being displayed is actually the price of the asset being moved over x number of bars. I have not found a way to plot a traditional horizontal line, as the code for it uses a fixed price.
As it being a user input, it is a variable. Any help with this would be appreicated.
Alerts are set to once per bar.
Known bug that sometimes if the prices that you set are inside the current candle stick, then your alert will immeaditally fire, either change the timeframe or let it fire and wait fo
After a target is hit, I reccomend setting the alert to 0 and REMAKING the alert. You MUST REMAKE THE ALERT AFTER ANY CHANGES. This script WILL NOT CHANGE ALERTS AS YOU CHANGE SETTINGS.
TradingView Alerts are not this smart , at least I haven't found a way to do this yet.

Auto Stop
A simple script using the last three bars(including the current) and draws a line on the chart under that for an easy automated stop loss point

Anti-Volume Stop Loss multi timeframe [LM]Hello Traders,
I would like to introduce you fork of popular indicator Anti-Volume Stop Loss created by Buff Dormeier and cracked here on tradingview by @Rafka so shout out to him. I have tried to crack it myself as well as I'm big fan of Dormeier's work but it's not easy so really big thanks to Rafka
I have refactored original script and have included multi timeframe setting.
As its shown below you can select higher timeframe to track lower one:
Enjoy!

Bitlinc MARSI Study AST w/ Take Profit & Stop loss - beta 0.1This script is beta 0.1 - will update as soon as the script is tradable
This script is based on AST on a 10 minute timeframe. You can change the asset and the timeframe for any asset you want to trade, but for it to work correct ALL settings have to be testes in the Strategy section of the TradingView. Each assets and timeframe require a different mixture of settings. This is NOT a one settings fits all trading for all assets on any timeframe. Below are the settings and explanation on how it works.
How it fires a buy / sell:
The script will plot an RSI with upper and lower bands in a separate indicator window. The idea behind this script is to fire a LONG when MA crosses OVER lower band and fire a SHORT when the MA crosses under the lower band. Each order that fires is an OCO (Order Cancels Order) for pyramiding.
Settings:
You have full control of these settings as mentioned above, you must configure every part of this script for each asset and timeframe you trade.
- Length of MA
- Length
- Upper bands of RSI
- Lower bands of RSI
- Take profit percentage
- Stop loss percentage
- Month to start and end the strategy (within 2020)
- Day to start and end the strategy (within 2020)
- Quantity type
- Slippage
- Pyramiding
***Remember that after the signal to enter or exit a trade is fired, the alert will trigger AFTER the close of the candle that caused the tigger to fire

ATR with Take and StopThis simple indicator will plot the take profit and stop loss values based on the ATR indicator.
It's possible to set how many times the ATR value will be applied to the closing price and
what trade type is used, Long or Short.

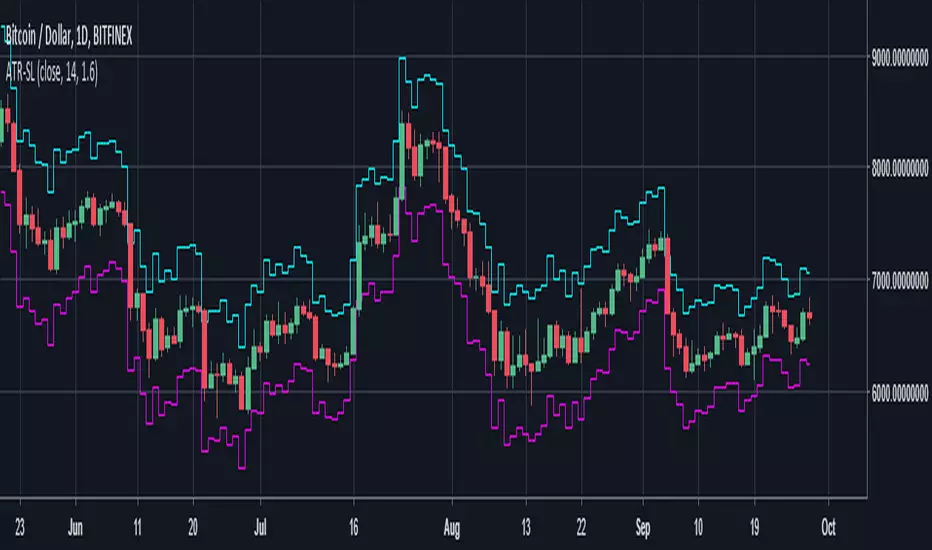
ATR Stop Loss LONG/SHORT by melihgulerYou can monitor the stop loss level according to ATR in 2 ways (Long/Short).

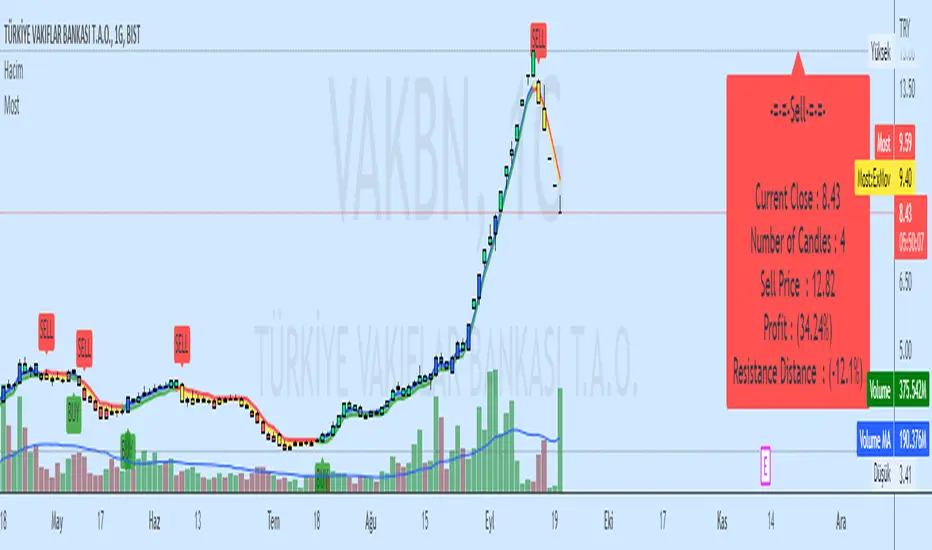
Moving Stop Loss (Most) by ceyhunATR is an indicator that has been removed and replaced with a moving average.Bar colors and infopanel have been added.
//Barcolor
Green = ExMov > Most and close > Most and low > Most
Blue = ExMov > Most and close > Most and low < Most
Red = Most > ExMov and close < Most and high < Most
Yellow = Most > ExMov and close < Most and high > Most
//It gives White color where there is deterioration.
//InfoPanel
Buy Price = Blue draws the circles at the purchase price.
Profit Long>20 = Risk level taken as a percentage, I got the highest 20%, you can determine as you wish.
Sell Price = Red draws the circles at the purchase price.
Profit Short>20 = Risk level taken as a percentage, I got the highest 20%, you can determine as you wish.
==Atr Original Code==
CDC ATR Trailing Stop V2.1 (2013)
==Most Code==
MOST by Anıl ÖZEKŞİ
Barcolor
Barcolor
RSI + EMA+ MTF Stop-LossThis is a simple RSI with multiple MTF (No security) to help with direction short and long-term.
The rsi for the current chart has a noise reduction, while the rest are based on ma's.
I have supplied an extra flexible mtf rsi ma for potential adjustable/long-term stop-loss or direction identification.
Enjoy

RSI Stop LossExperiment for using RSI as a stop loss value, shows where the price will be when the RSI increases or decreases by a specified amount.


ATR Pips with Stop LossThis indicator shares ATR pips and a calculated 1.5 x stop loss calculation.
1st number is ATR.
2nd number is ATR x 1.5 (a typical SL when trading daily time frame).
The plot lines are really not that important- it's the actual numbers.
What I do is uncheck the plot line checkboxes (ATR & SL) so it doesn't show up, that way I can reduce the indicator window.
This script is a modified script by ATR Pips . Kept the BB section for now as it might be useful, but doubt it.
Future updates:
- editable the multiple for SL
- static daily numbers (right now this shows the timeframe you are viewing, I'd keep that but add a static daily ATR so you have both)

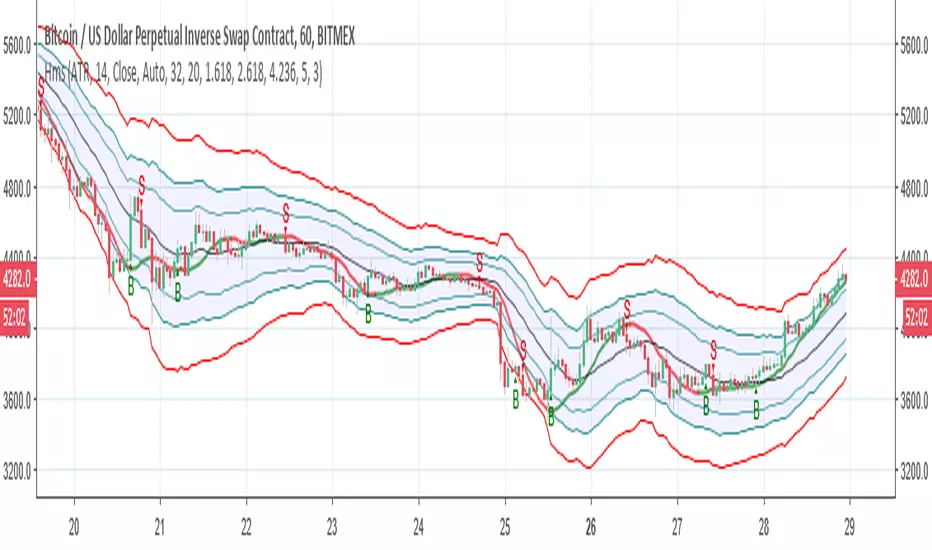
poki buy and sell Take profit and stop lossThis indicator is based on modelius model of lazy bear weis model with ATR for the buy=B sell =S
in addition there is Take profit and stop loss in % both for short and for long
next stage is to know the resistance level and support based on bollinger marked in blue and red dots
Also included Parabolic Sar (blue and red dots rising up or down)
The color of bulish or bearish zone is based on the cross of Hull avreage and linear regression ( for each time set may need different setting for accuracy )
So how to use this scrupt to better profit
1. if you have B signal and its on lower support level then its good starting place for buy. look at the Parabolic Sar if its in agreement. The exit can be either by S =sell, Take profit that you decide on % or by end of Parabolic SAR upward
2. exact the oposite for short
Play with setting for the desired results or change modify this script for your purpose

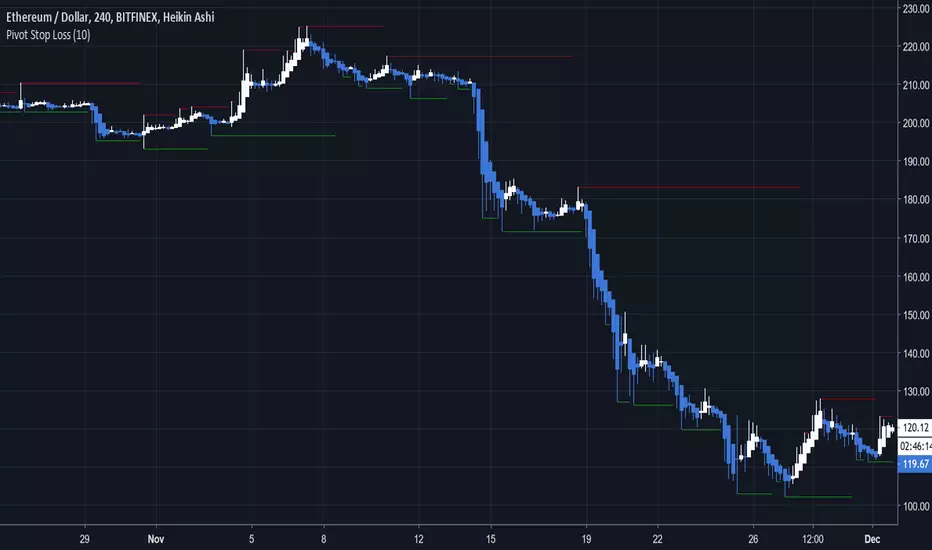
Pivot Stop LossHere we intend to use pivot points for stop loss and take profit. This has the added benefit of helping you to visualize support and resistance levels.
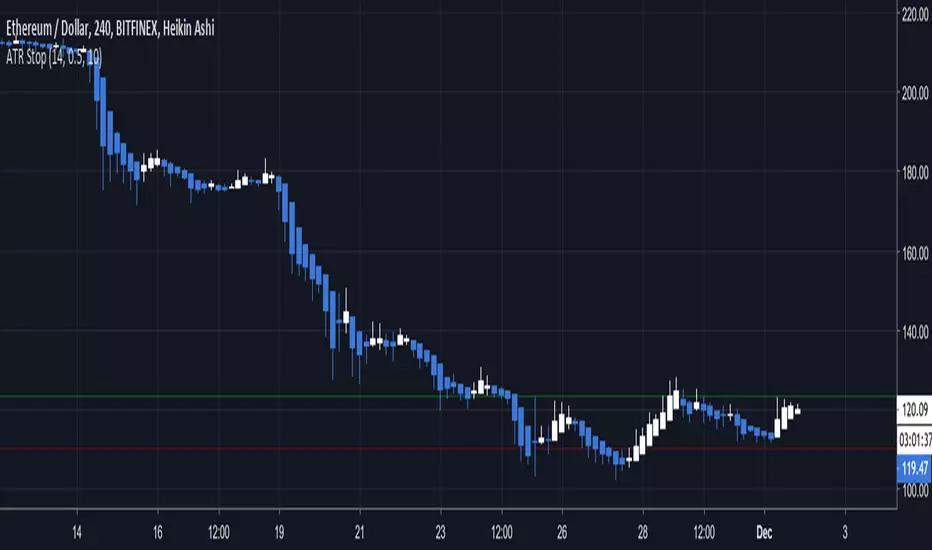
ATR Stop Loss VisualizerThis will help you figure out what stop loss settings work best for you. Some people might prefer ATR 14 * 0.5 for shorter timeframes, some might prefer more extreme settings such as ATR 30 * 2 to not get stopped out as often.
Hull modelius take profit and stop lossThis model has Hull moving average, fibs in form of Bollinger ,SMA and Modelius model with ATR for buy and sell power based on weis volume. Inside alerts for buy and sell. take profit and stop loss for both longs and shorts
so have fun
StopLoss Calculator ... Manual or Chart Entry, EUR or perc. RiskStop-Loss Calculator for manual or chart entry, EUR or % risk. Works for long & short positions on all timeframes. Entry and stop-loss lines are fully customizable. Use at your own risk.
Stop-Loss Rechner für manuellen oder Chart-Einstieg, Risiko in EUR oder %. Funktioniert für Long- & Short-Positionen in allen Timeframes. Entry- und Stop-Loss-Linien sind vollständig anpassbar. Nutzung auf eigenes Risiko.
Stop-Loss Calculator – Manual or Chart Entry, EUR or % Risk
This indicator calculates the optimal stop-loss price for trades based on the selected entry, position size, and risk tolerance. You can choose between manual entry or using the current chart price, and define risk as either a fixed amount (EUR) or a percentage of your capital. It works for both long and short positions and is compatible with all timeframes.
The script plots the entry and stop-loss levels, with colors and line styles fully customizable.
How to Use
Entry Selection: Choose between the chart’s current price or a manual entry price.
Position Size: Enter the number of units/shares/contracts you are trading.
Risk Mode: Select Absolute (EUR) or Percent (%). Enter the corresponding value.
Direction: Choose Long or Short.
Stop-Loss: The script automatically calculates and displays the stop-loss line.

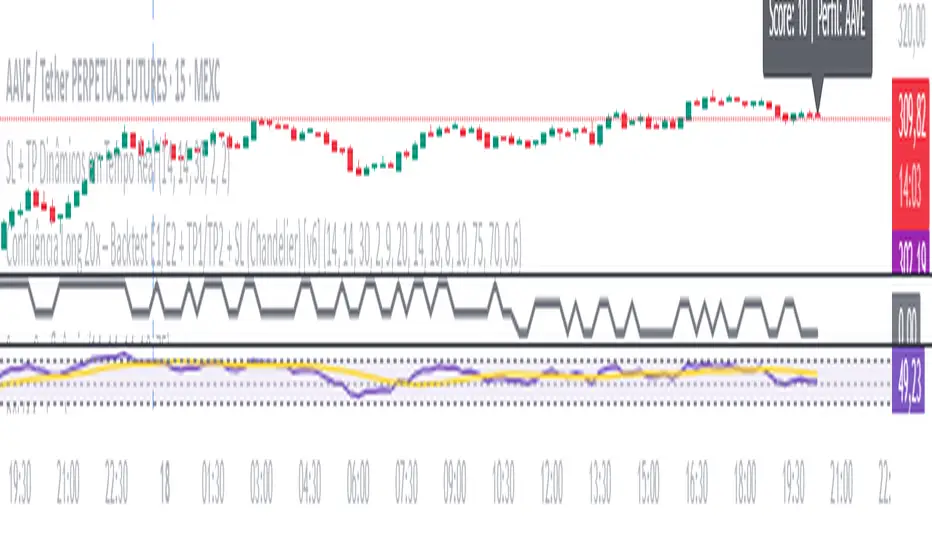
SL + TP Dynamics - By M.LolasStop Loss e Take Profit dinâmicos para operações semiautomatizadas.
By M.Lolas
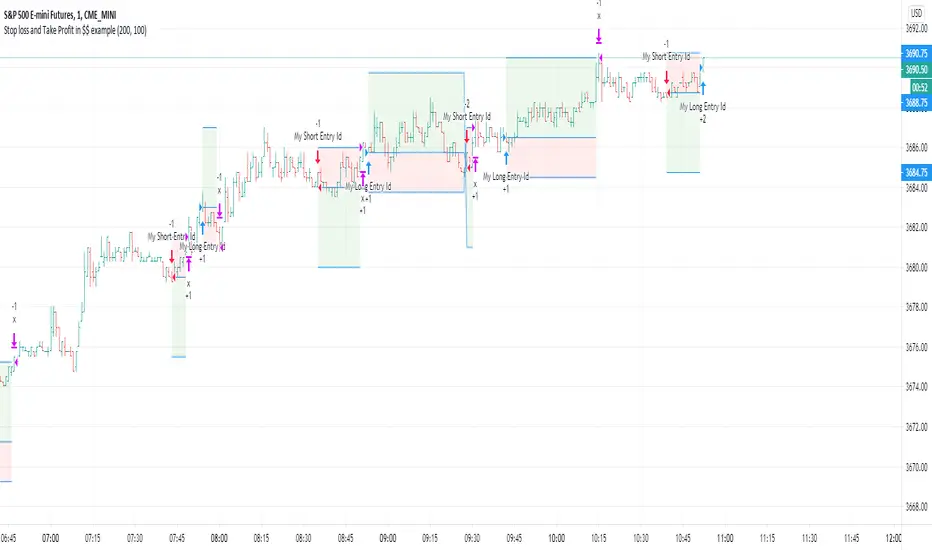
Stop loss and Take Profit in $$ exampleThis is a simple exit example in $$ (symbol's currency) for educational purpose .